Project: Climate Change
|
Climate change is when the weather patterns and temperature overall in a region change over time. Global warming is the tendency for temperatures of the entire world to increase over time. Climate change, at least in the modern day, is a result of global warming. Global warming is often caused by an increase in greenhouse gases and can cause ice levels to decrease by warming the oceans. Warmer oceans can cause an extreme change of climate in coastal regions especially.
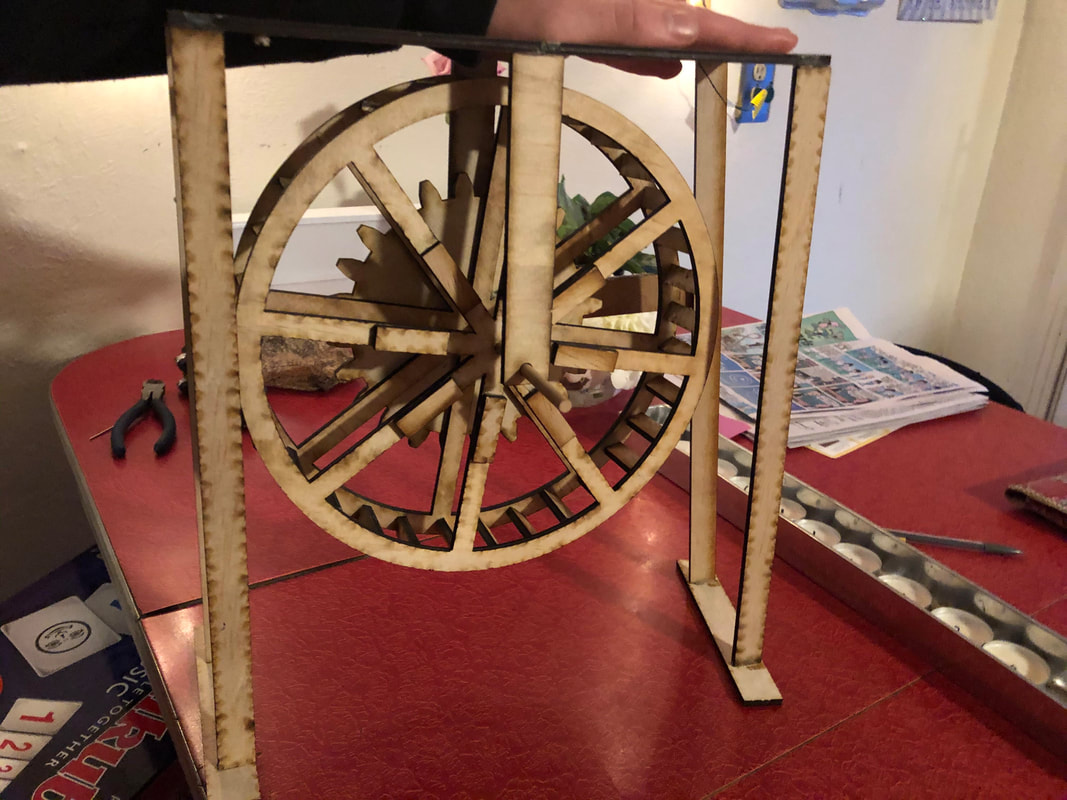
Humans are causing climate change to be sped up. Climate change has happened many times in the past, and is a natural process. The problem is that in the modern day it is changing too fast as a result, and most things on earth cannot adapt fast enough to these new climates. An increase in sea level as a result of melting ice caps and an increase in ocean temperature also puts entire countries at risk, such as the Maldives. The Maldives will be underwater within 30 years. If we don’t do something about these changes throughout the world and what is causing them it will be too late. My project suggests a small scale supplementary solution to climate change. One of the most commonly accepted causes of climate change is the burning of fossil fuels to generate electricity, and green electricity sources will eliminate this. Me and my partner created a design for a small scale water wheel, that’s easy and cheap to create, easy to move around and position, and able to generate some clean, supplementary power to make individuals less reliant on the power grid. For people who have access to a source of moving water at least. My largest area of growth during this project was learning to adapt and modify my project to make it more realistic, doable, and ultimately better at the exhibition. My group began the project with preparations to make a large water wheel, with a large and powerful generator. We most of our materials, began the design process, but realized that making the full sized wheel during the project was not realistic. After that, we opted to make a small model of our final design. This way, we could make something better than an incomplete project, and would be able to show our intentions better than one that was not complete. During this project, my biggest strength was working in a group. Me and my partner were able to effectively delegate tasks based on our skills to more efficiently complete our project. I have more experience with engineering and design work, so I was the one who designed and cut out our final product. My partner, Robert focused more on the presentation side of our project. Then when both the design and presentation aspect were completed, we both worked together to construct our final product. This translated into the exhibition, where each of us was able to present the part of the project we did. |
|
Project: The Biological Needs of Adolescents.
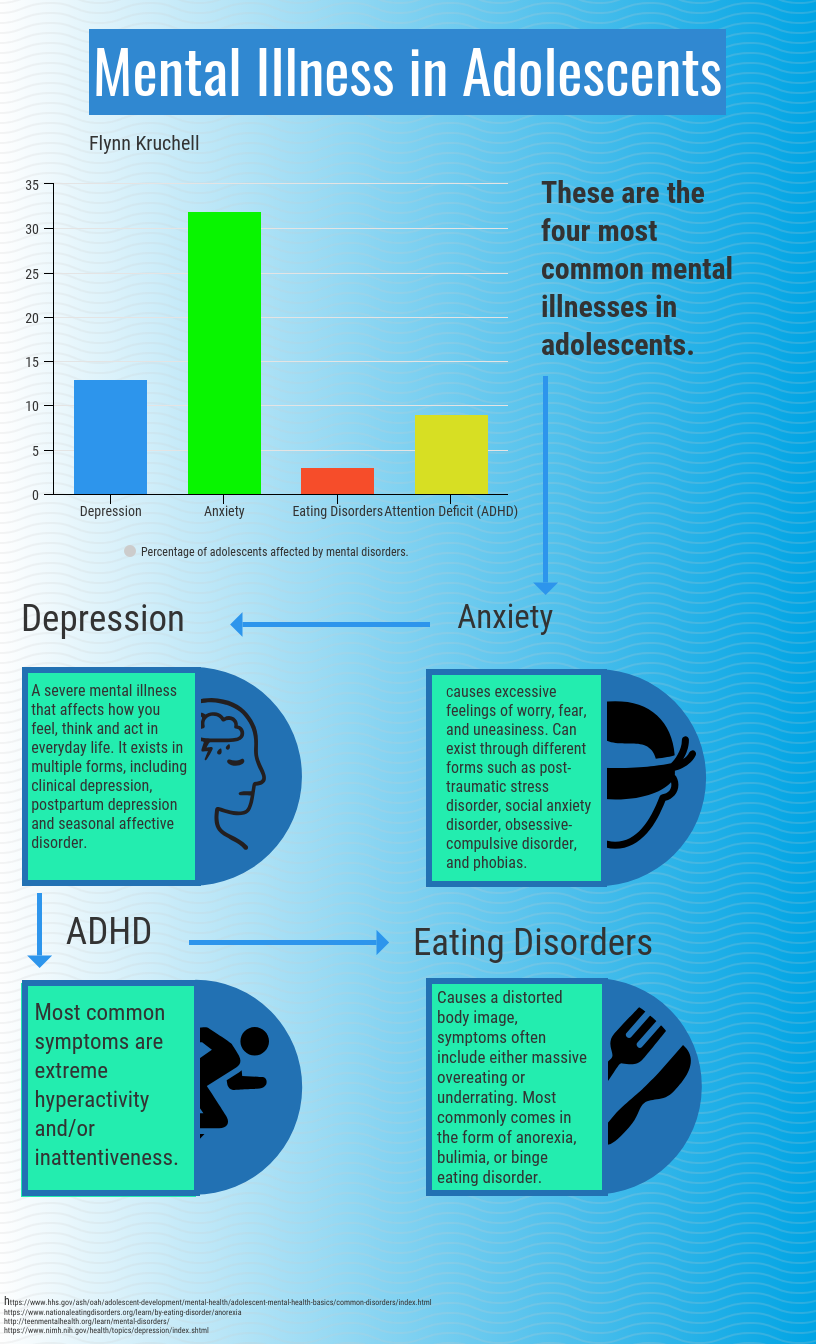
Project DescriptionThe project was about adolescents and what they need biologically within the confines of our biology course. We made infographics as a final product to showcase what the needs of an adolescent individual are. We studied this both through a physical and a mental health lens. This project was important because it helped to teach the students of the 10th-grade class about their own psychology from a scientific perspective. I think it helped us all understand ourselves a bit better.
|
Project ReflectionMy biggest challenge during this project was finding a topic I was interested in for the infographic. I personally don’t have very much interest in psychology or adolescent development and prefer not to talk about my own personal life. Eventually, I was able to settle on an idea I have some interest in and was able to make a successful infographic.
Creating an infographic out of something I didn’t have much interest in in the first place was my greatest success during this project. As stated above I don’t have very much base interest in adolescent psychology. Despite this I found myself engaged in my research and actually interested in the data that goes with adolescent mental illness. If I were to do this project again I would just make an infographic that could tell a better story. I had the data and the base information present but it didn’t really have anything to tie it all together. It was basically a bunch of basic information string together based on how common each mental illness is. If I had more time I would have implemented data on how these numbers have risen and fallen over time, what causes these mental illnesses and maybe even some basic predictions of how this data may look in 10 or 20 years. |
